Everyone wants the magic number. The single figure that confirms, once and for all, that a model is genuinely reliable. But market mix modelling does not bend to that fantasy. We have learned that trust is not earned through one neat metric but through how a model behaves in the wild, well beyond the comfort of its training data.
That is where “out of sample testing” earns its place.
The Real Test Begins After Training
Any model can look impressive on the data it has already digested. That is the hallmark of overfitting - explaining yesterday brilliantly yet fumbling tomorrow. So we draw a clear line. Train the model up to a fixed point, for instance the end of 2025, and then ask it to predict what actually happened next. Early 2026 becomes the proving ground.
We repeat this across rolling windows of one, three and six months. The goal is not simply early accuracy, but durability. Does the model hold its shape as the months progress? Or does it unravel at the first hurdle?
If it collapses straight away, it has not found signal. It has simply memorised noise.
Why MAPE Matters
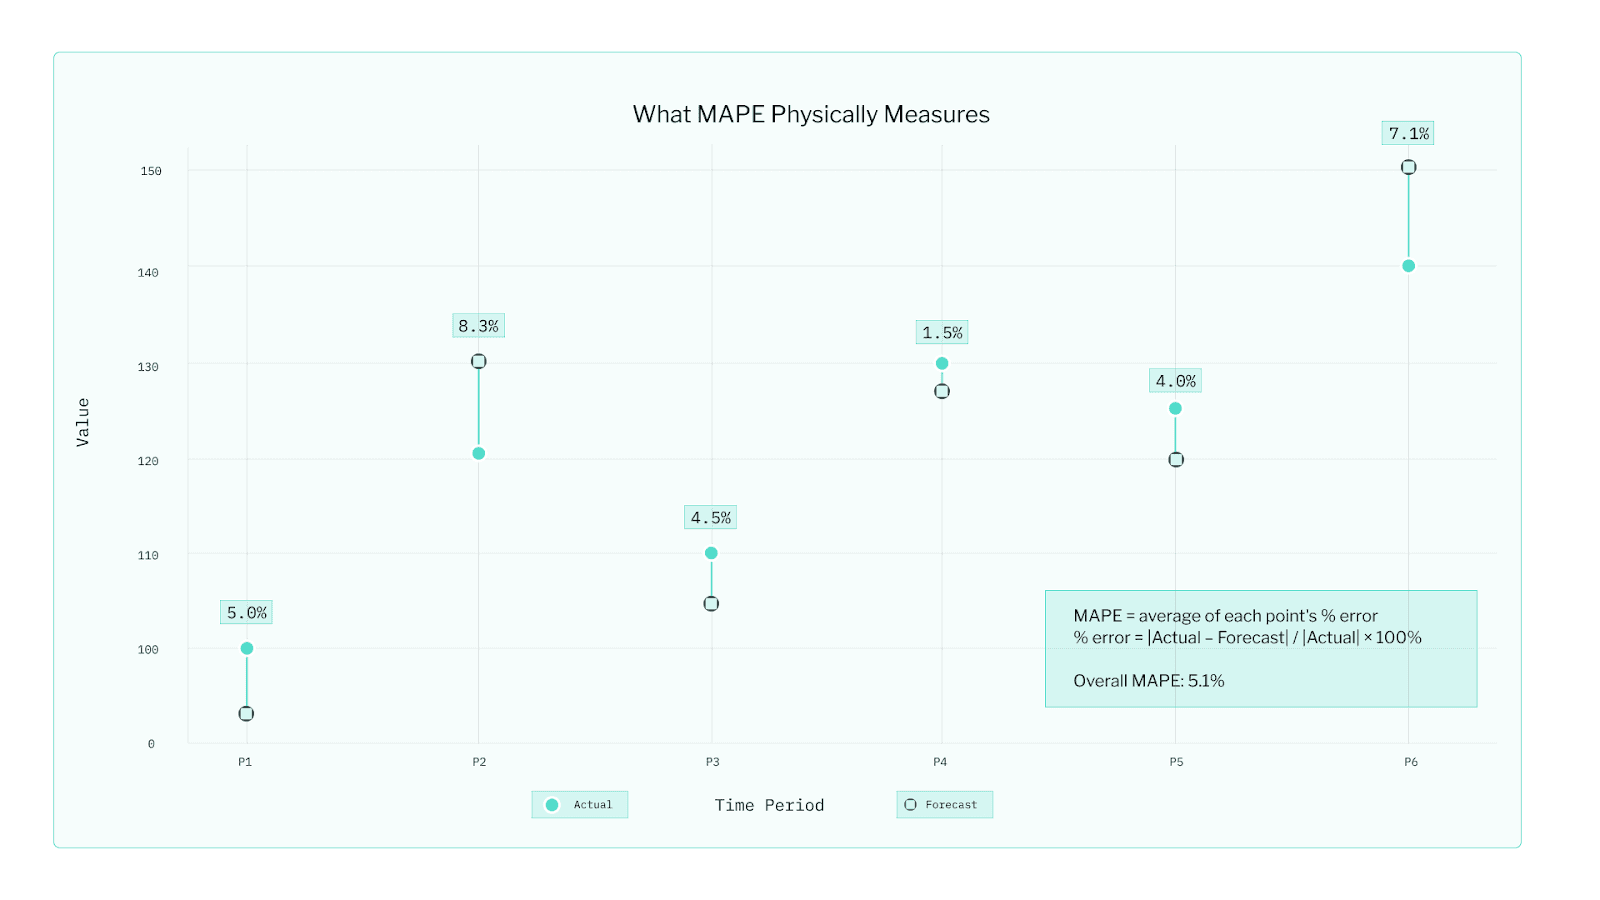
The headline measure we use is MAPE, the Mean Absolute Percentage Error. It sounds technical, yet it answers the most human question - on average, how far off were we?
It is intuitive enough for a boardroom and robust enough for a data science review. Of course, our Bayesian models track deeper diagnostics such as WAIC and CRPS, which weigh uncertainty and distribution. WAIC (Watanabe–Akaike Information Criterion) measures how well a Bayesian model explains the data it was trained on while avoiding overfitting. A lower WAIC means the model fits the data well but remains general enough to handle new situations. CRPS (Continuous Ranked Probability Score) evaluates how accurate and well-calibrated a model’s full predictive distribution is, not just its average prediction. A lower CRPS means the forecasts are close to reality and the uncertainty bands are realistic. They are invaluable for comparing candidate models, but far less intuitive for most stakeholders. When it comes to communicating results, MAPE carries most of the weight.
The Art Beside the Science
Numbers never tell the full story. So we keep a model evaluation notebook. It is part laboratory log, part truth serum. Filled with plots, checks and commentary, it creates transparency both for our team and our clients.
The first page is always the actual versus predicted plot. If reality jumps while predictions glide serenely, something is missing. You see this starkly in categories like lottery sales, where jackpot size can send weekly revenue soaring. If that driver is absent, the plot gives the game away.
We also track ROAS (Return on Ad Spend) and attributed sales over time - essentially, how much revenue each marketing dollar appears to generate and how much of total sales our model assigns to each channel. If a channel suddenly shows implausibly high returns - say, claiming $40 back for every dollar spent - we don’t celebrate; we pause and investigate, because such spikes often point to data issues, overlapping campaigns, or model noise rather than true performance.
Consistency Is the Quiet Superpower
A trustworthy model is not a one-hit wonder. It performs again and again as new data arrives. Each time we re-fit, we look for stability. If MAPE swings wildly or if a major channel’s ROAS shifts with no clear reason, that movement is a clue in its own right.
Every evaluation cycle yields a scorecard that covers:
Out of sample MAPE at one, three and six-month horizons
Sanity checks on ROAS and attributed sales
Diagnostic plots - actual versus predicted, ROAS trends, attributed sales trends
Notes on what changed but also why it changed.
From Confidence to Credibility
In the end, trustworthy MMM is not a pursuit of perfection. It is a pursuit of repeatability. It is the ability to say, with evidence, that a model does more than recount the past. It anticipates what comes next.
A model that holds out of sample, stays steady over time and produces results that are both plausible and interpretable is a model you can act on with confidence.
Because in measurement, much like in marketing, the proof is always out of sample.