
Australian companies can tell you what happened in their business this morning… things like sales, website traffic, campaign performance or stock levels.
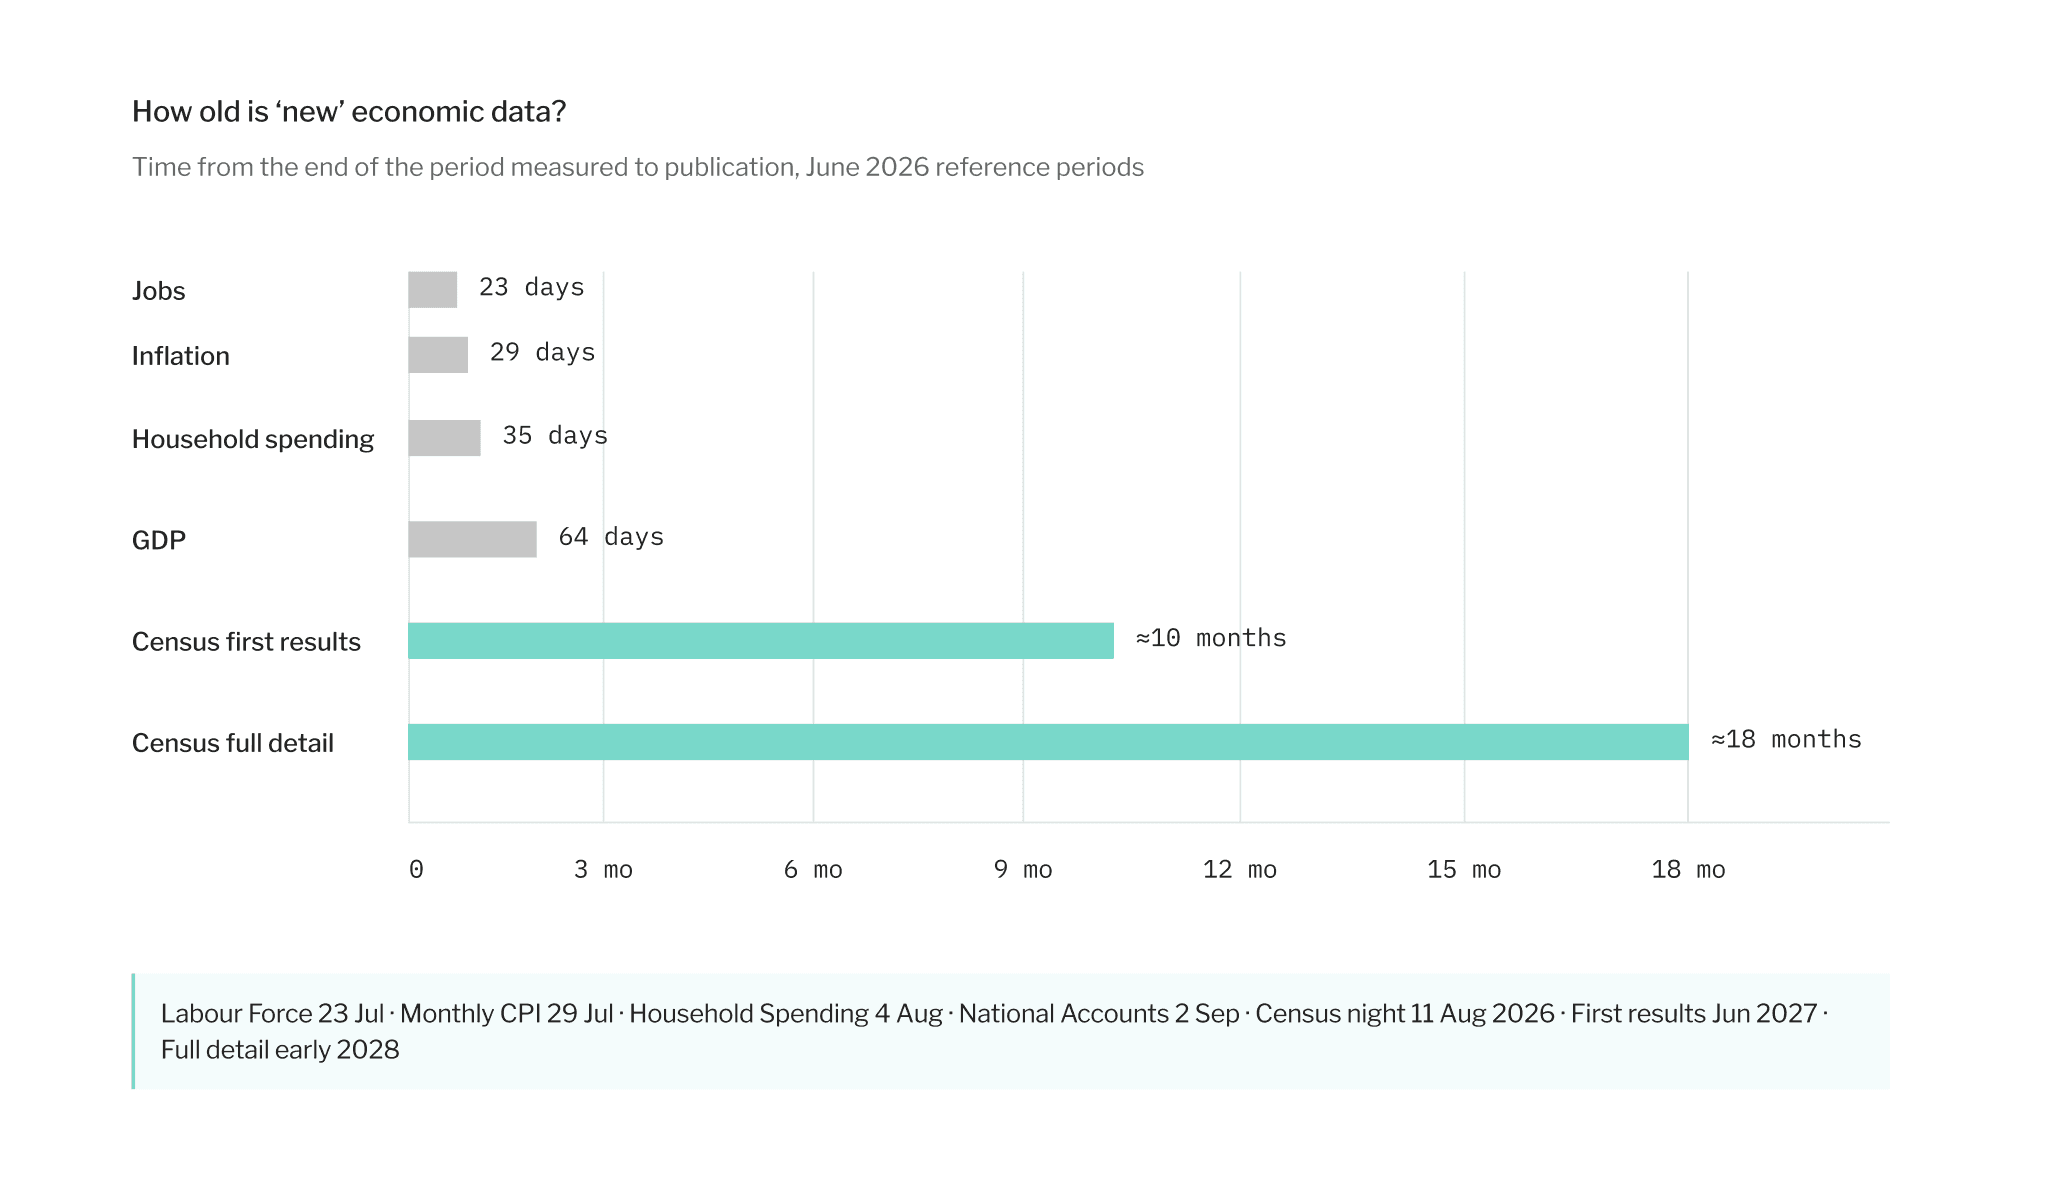
But when they look at the broader economy, they are often making decisions using information collected weeks, or sometimes months, earlier.
That has become so normal that we hardly question it.
Next Tuesday, almost every Australian household will complete the Census - the richest, most detailed snapshot of the country we have. Nothing else comes close to understanding who lives where, how communities are changing, or how industries are evolving.
It is also one of the datasets where the journey from collection to publication takes the longest. The first results will arrive in June 2027 - almost a year after data was collected - with the full picture not available until early 2028. That timeline reflects the complexity of collecting, validating and publishing information on almost 28.5 million people.
But it’s worth the wait.
Census data anchors a large share of the state-level detail in the indexes we build for clients. It does not drive our daily view of the economy, instead every five years it recalibrates the baseline those daily measures run against. Nothing else comes close to providing that level of geographic and demographic detail.
The Census is simply the clearest example of a much broader reality.
Every month we see the same patterns play out with inflation, employment and retail spending figures. As soon as those releases land, the conversation immediately shifts to what it means for interest rates, business confidence or consumer demand.
What is often overlooked is that the data itself describes an economy that has already moved on.
Colleagues call me "the Macro Man", and after years working in macroeconomic modelling, one observation has always stumped me - we have come to accept delays in economic information as though they are a law of physics. They are not.
The ABS and Reserve Bank do exactly what they are supposed to do. Official statistics prioritise accuracy, consistency and trust. However, business operates on a different clock.
A retailer deciding how much inventory to carry into Christmas cannot wait for next quarter’s confirmation. A CFO making investment decisions cannot rely on hindsight and neither can a CMO deciding whether to increase marketing investment while conditions are changing around them.
Yet we still behave as though quarterly releases are the moment the economy changed, rather than the moment we finally found out about it.
The economy does not move quarterly. Commodity prices shift, exchange rates move, hiring conditions tighten, and consumer confidence changes. Thousands of signals evolve every day while the headline figures are still weeks away.
Finding the signal beneath the noise
The challenge is understanding which signals matter.
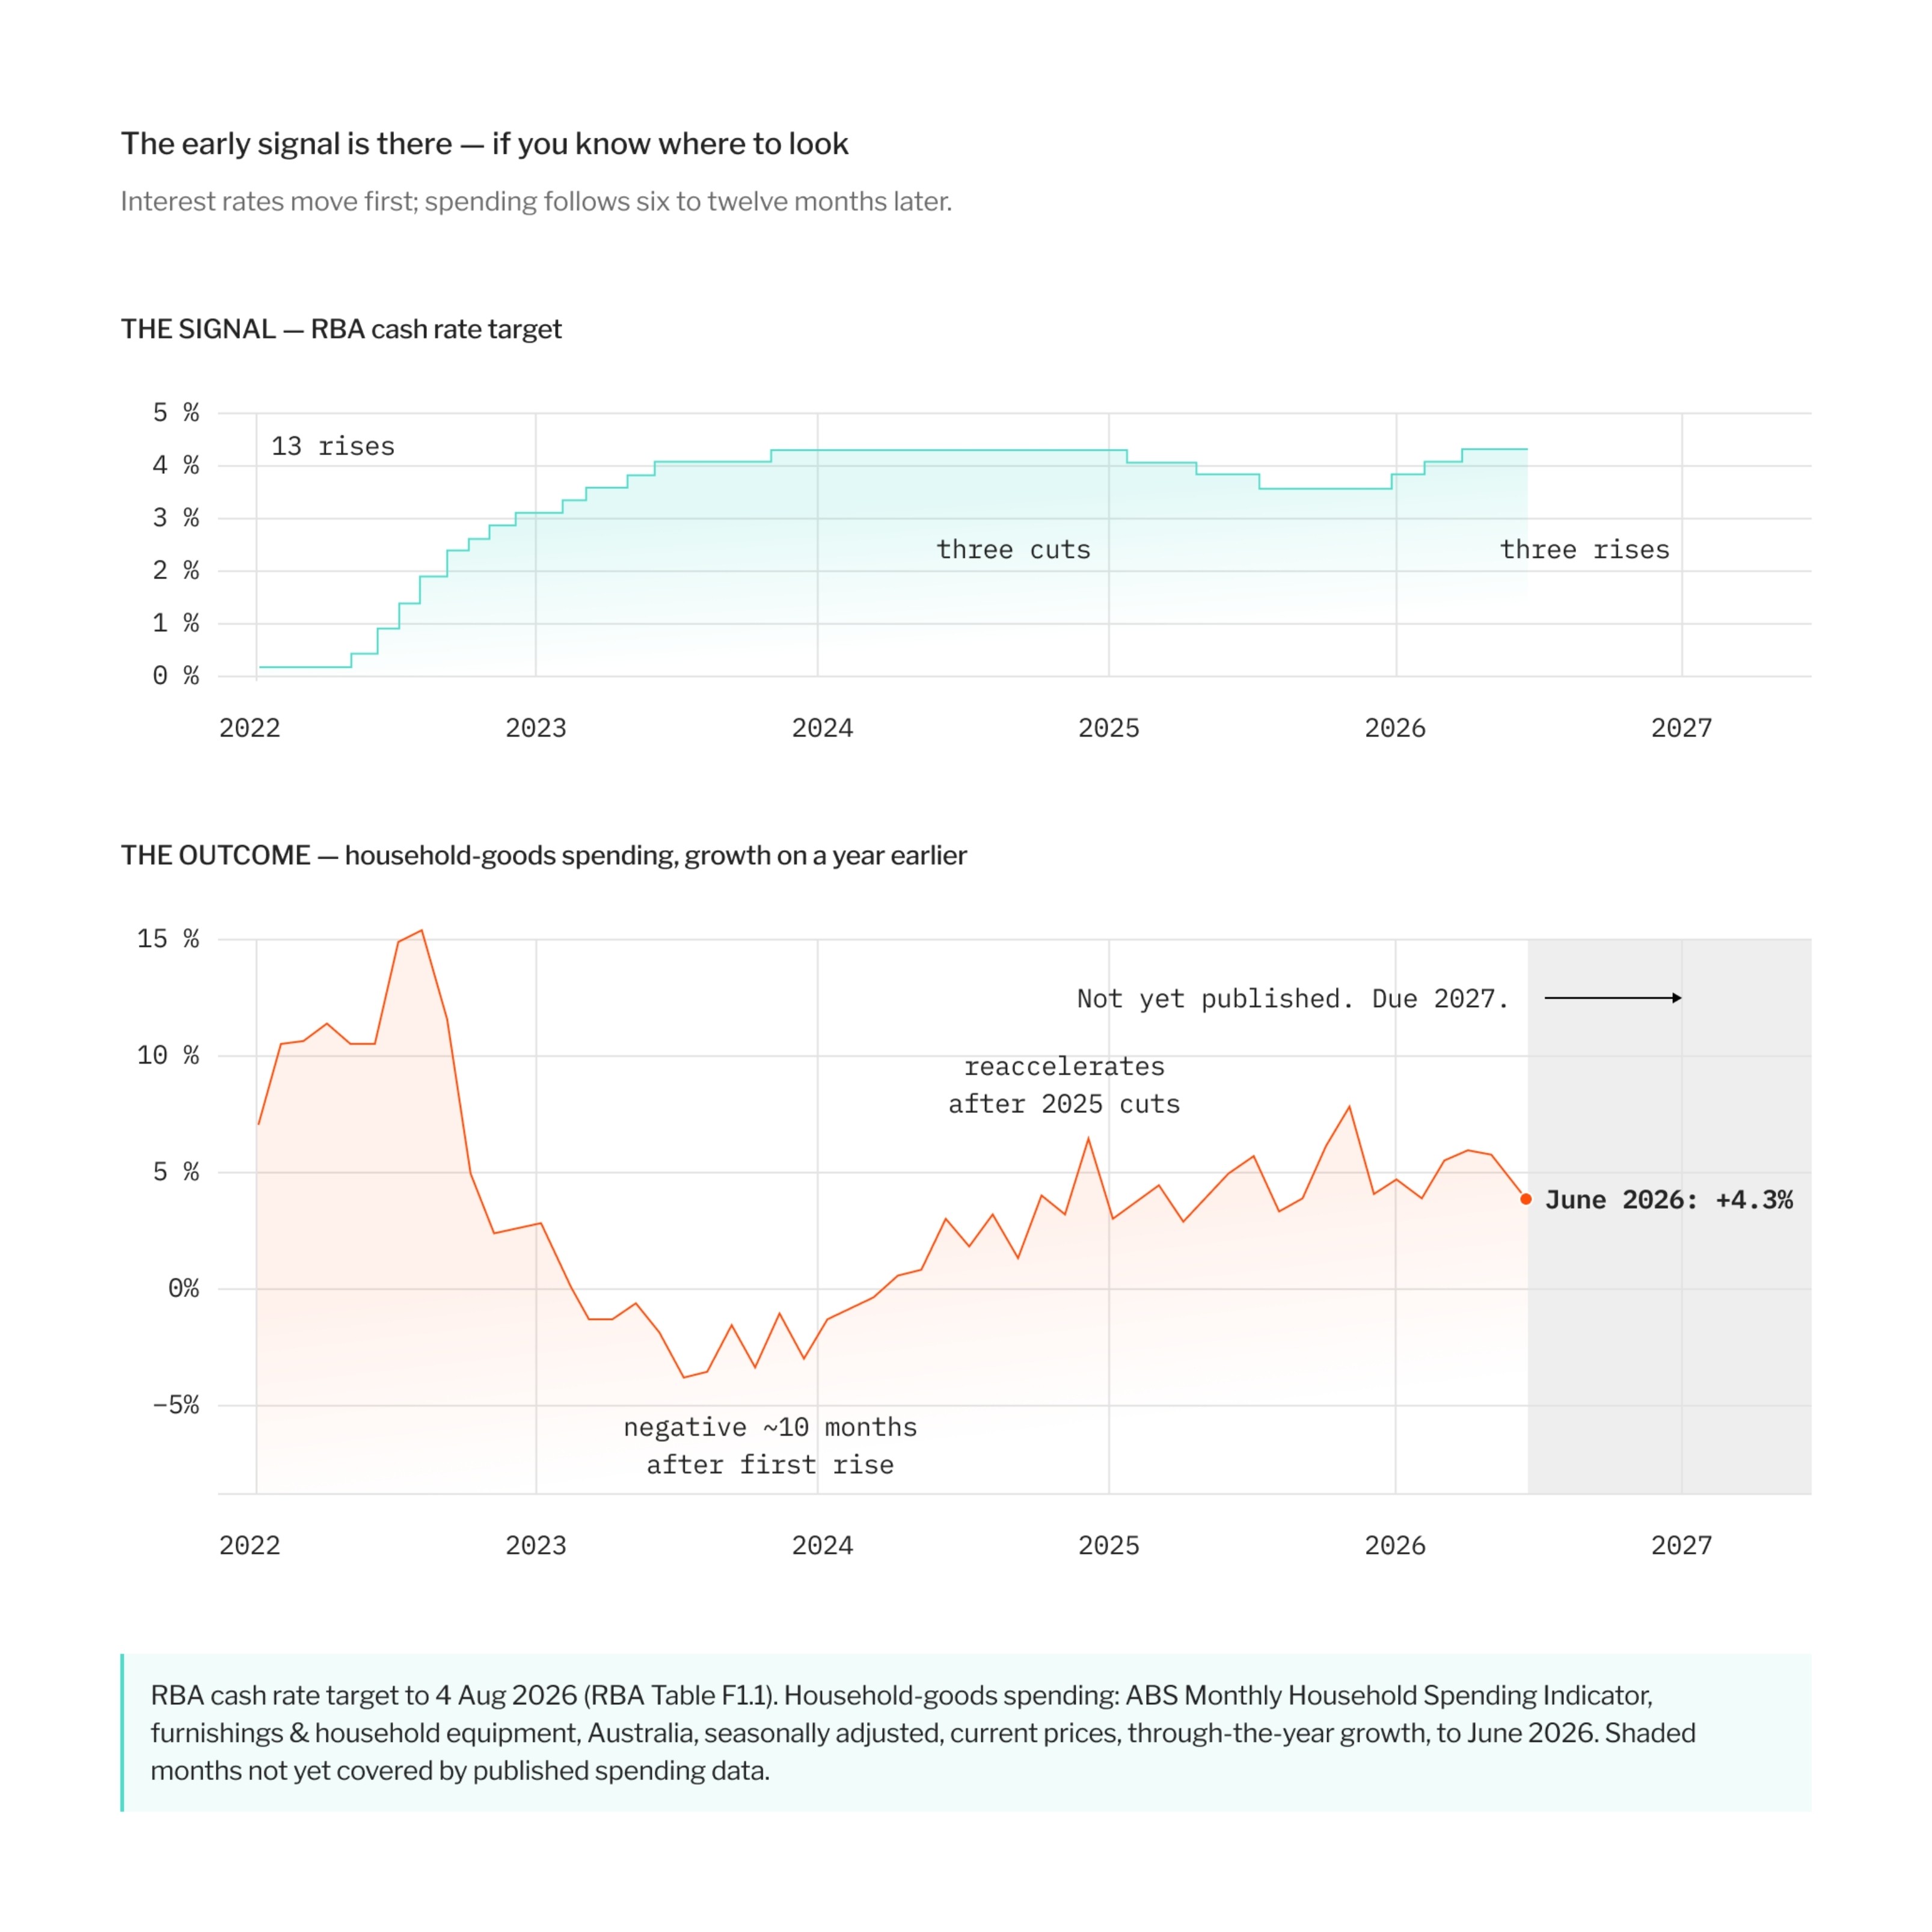
No individual indicator tells you very much on its own. But when thousands of public indicators are viewed together, clear patterns begin to emerge. Some indicators consistently move ahead of others, like interest rates rising before furniture sales slow a few months later. Those relationships evolve over time - some strengthen, some weaken, and some disappear altogether. Yet the broader structure of the economy remains remarkably consistent, even when the headlines suggest otherwise.
This is where techniques like “principal component analysis” (PCA) become useful. PCA identifies groups of variables that tend to move together, such as hot weather and ice cream sales during summer, helping separate underlying economic signals from the daily noise around them.
We apply this type of analysis across a large set of economic indicators to build daily indexes that show how conditions are evolving. Some data points move by the hour, while others update monthly or quarterly. Bringing those signals together provides a more timely view of economic movements while remaining aligned with the official measures businesses already rely on.
When the economy breaks its patterns
COVID is a good example of how those signals behave under pressure.
At the time, it looked like every historical relationship had broken down. It was an extraordinary outlier. As more information became available, many of the underlying relationships re-emerged, reminding us that dramatic events can overwhelm the normal mechanics of the economy without permanently rewriting them.
That is why I am always sceptical when someone declares that "everything has changed." Usually something has changed, but seldom everything.
The gap between knowing and deciding
Businesses can measure what is selling today, how yesterday's campaign performed and where demand is emerging. Then they zoom out to understand the broader economy and suddenly they are relying on information that is weeks or months old.
Somehow, delayed macroeconomic information has become normal. It remains one of the last areas where businesses accept working from a rear-view mirror.
The Census will continue to provide the depth and detail that only a true national snapshot can deliver. It will tell us where Australians have moved, how communities have changed and how the country has evolved since 2021. Every business benefits from that picture, even if it only arrives every five years.
In between, businesses don't have to fly blind. The opportunity is to understand how thousands of macroeconomic signals interact. Individually, they'll always be noisy; together, they reveal the conditions businesses are operating in today and where those conditions are heading, giving leaders a clearer view of the economy long before official confirmation arrives.
The economy has always been moving in real time. It's our view of it that's been running behind.